Table of Contents
Python + Filters + FFT + Gnuplot
Noise
Filters
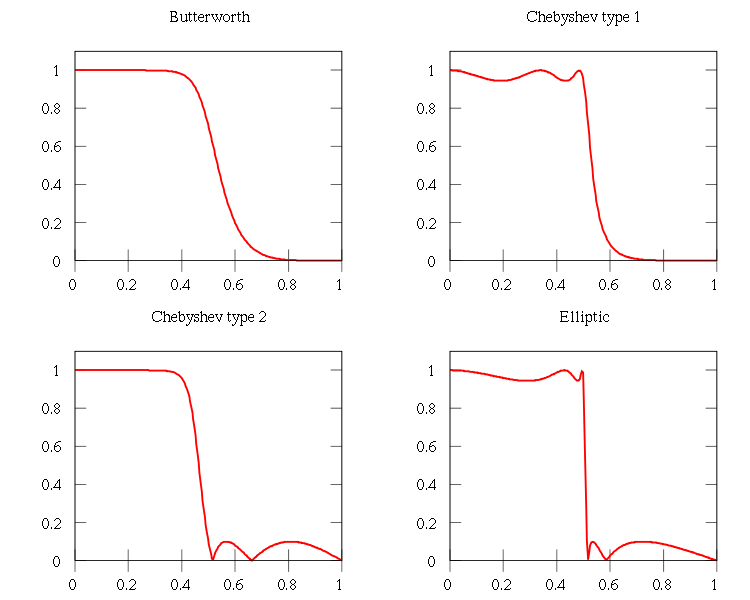
Linear filters
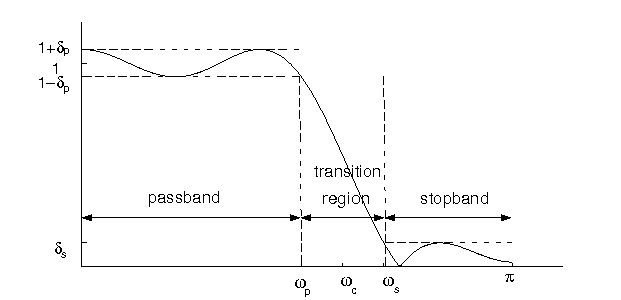
There are five basic parameters to design a filter: wp (pass frequency), ws (stop frequency), gpass (pass gain), gstop (stop gain), filter type
Non linear filters
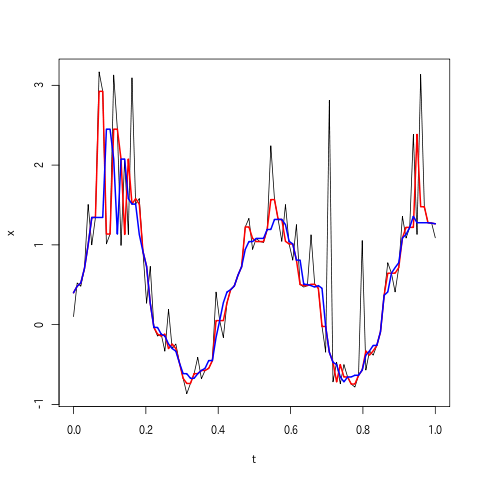
Median filter
Sharpness: high pass filter
Fast Fourier Transform
Example
The following example code takes data from a phidget analog input and filters this signal using first a IIR filter, then a median and then it calculates the FFT of the whole signal.
import scipy.signal as filters
class filter:
    def __init__(self,wp,ws,gpass,gstop):
        self.b,self.a=filters.iirdesign(wp,ws,gpass,gstop,ftype='ellip')
        self.z=filters.lfiltic(self.b,self.a,[])
        self.M=len(self.b)-1
        self.N=len(self.a)-1
        self.K=max(self.M,self.N)
    def get_output(self,input):
        '''input must be of size N'''
        self.output,self.z=filters.lfilter(self.b,self.a,input,zi=self.z)
        return(self.output)
    def get_N(self):
        return self.N
    def get_ab(self):
        return([self.a,self.b])
    N=property(get_N)

from Phidgets.PhidgetException import *
from Phidgets.Events.Events import *
from Phidgets.Devices import *
import numpy as n
ik=InterfaceKit.InterfaceKit()
ik.openPhidget()
ik.waitForAttach(10000)

my_filter=filter(0.1,0.3,1,60)
N=my_filter.N
time_array=[]
total_input=[]
total_output=[]
import time
inittime=time.time()
while True:
  t=[]
  input=[]
  for i in range(N):
      t.append(time.time()-inittime)
      input.append(ik.getSensorValue(0))
      time.sleep(0.05)
  output=my_filter.get_output(input)
  time_array=n.concatenate((time_array,t))
  total_input=n.concatenate((total_input,input))
  total_output=n.concatenate((total_output,output))
  if t[-1]>10:
      break

total_output_median=filters.medfilt(total_input,kernel_size=11)

import Gnuplot
g=Gnuplot.Gnuplot()
g.title("filter")
g('set data style linespoints')
g.plot(zip(time_array,total_input),zip(time_array,total_output))
raw_input()
import scipy
from math import pi
fft=scipy.fft(total_input)
g.plot(zip(n.arange(0,pi,pi/len(fft)),fft[0:len(fft)/2]))
raw_input()
g.plot(zip(time_array,total_input),zip(time_array,total_output_median))
a,b=my_filter.get_ab()
w,h=filters.freqz(b,a)
from numpy import log10
h_db=20*log10(abs(h))
raw_input()
g.plot(zip(w/max(w),h_db))

while True:
  time.sleep(0.1)


